$ in Billions
2020 $5.51
$ in Millions
(as adjusted)
2020 $400
(as adjusted)
2020 $3.07
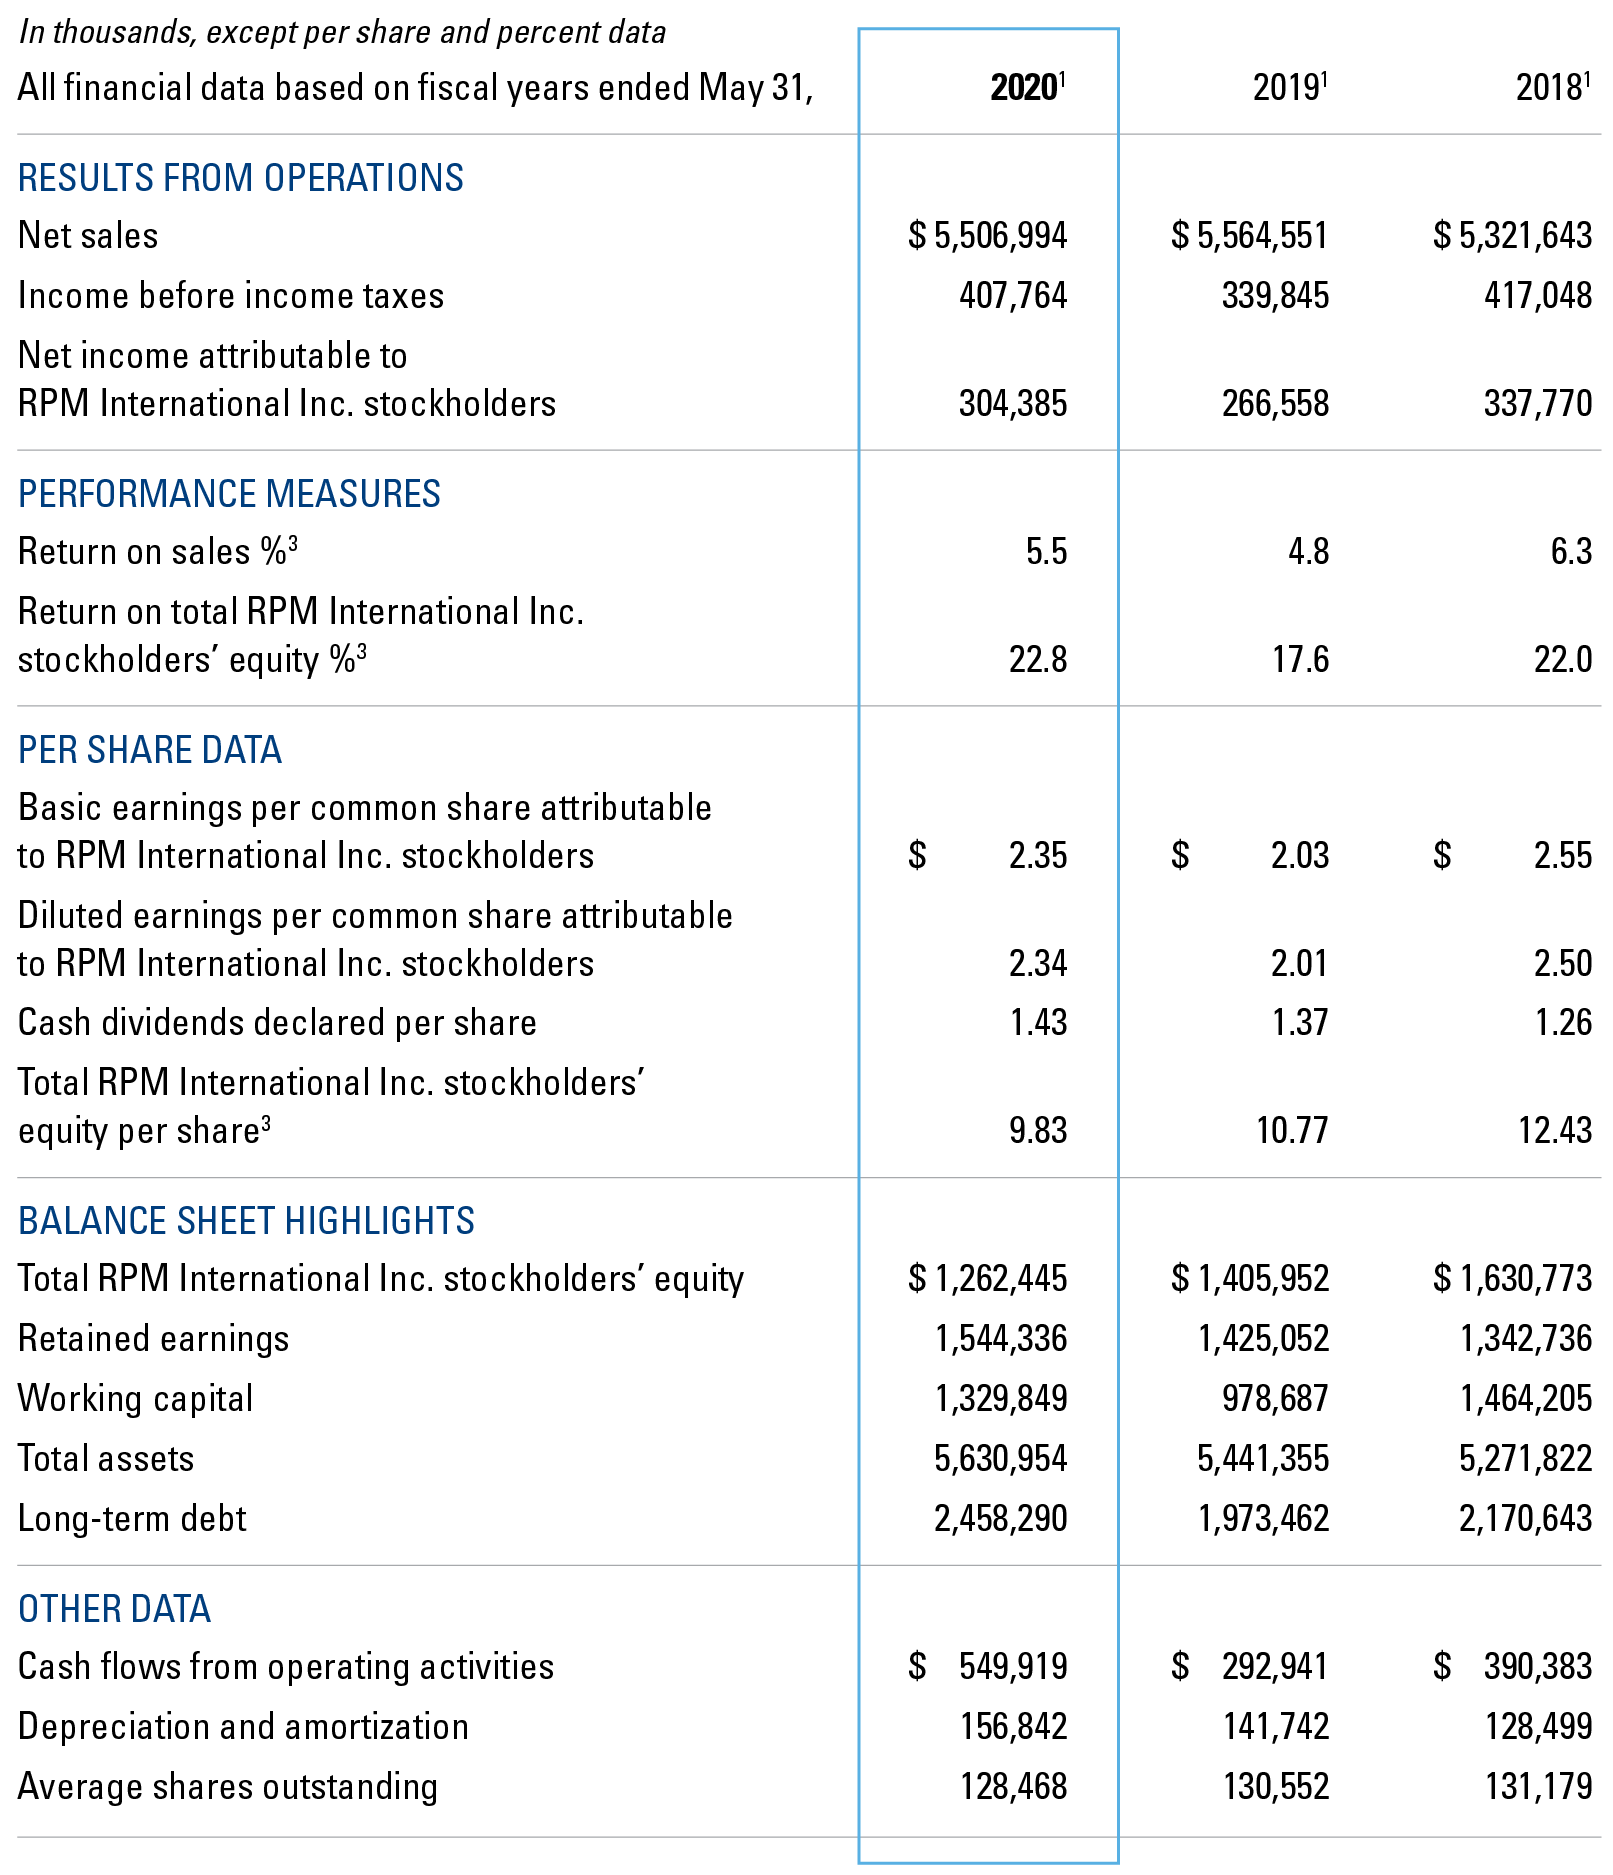
(1) Consolidated figures presented in the table above reflect as-reported data. Refer to the accompanying adjusted data charts provided in conjunction with the explanatory footnotes below for a discussion of the impact of one-time items. • Acquisitions made by the company during the periods presented may impact comparability from year to year. • Certain reclassifications have been made to prior-year amounts to conform to the current-year presentation. • See Notes to Consolidated Financial Statements.
(2) The following description of adjustments to net income and diluted earnings per share by fiscal year are presented on an after-tax basis. • Fiscal 2018 excludes (i) $4.2 million related to the decision to exit Flowcrete China with a $0.03 impact on diluted EPS; (ii) $12.1 million for restructuring expense, with a $0.09 diluted EPS impact; (iii) $25.8 million for inventory-related charges associated with product line and SKU rationalization and related obsolete inventory identification at our Consumer Segment and inventory write-offs in connection with restructuring activities at our Construction Products and Performance Coatings Segments, with a $0.19 diluted EPS impact; (iv) $1.0 million related to professional fees incurred in connection with the negotiation of a cooperation agreement, with a $0.01 impact on diluted EPS; (v) $1.0 million for implementation costs associated with an ERP consolidation plan by our Specialty Segment, with a $0.01 diluted EPS impact; (vi) realized investment gains of $10.0 million, with an ($0.08) diluted EPS impact; and (vii) an adjustment to tax expense for $18.1 million for a discrete tax adjustment related to a foreign legal entity realignment and corresponding tax planning strategy, with a ($0.13) impact on diluted EPS. • Fiscal 2019 excludes (i) $16.7 million resulting from more proactive management of inventory, partially offset by a true-up of prior year inventory write-offs at our Consumer Segment and charges related to restructuring activities at our Construction Products and Performance Coatings Segments, with a $0.12 diluted EPS impact; (ii) $32.5 million for restructuring expense, with a $0.24 diluted EPS impact; (iii) $4.3 million resulting from accelerated depreciation related to the shortened useful lives of facilities currently operating, but in the process of being prepared for closure, with a $0.03 diluted EPS impact; (iv) $6.3 million reflecting the net increase in allowance for doubtful accounts deemed uncollectible as a result of a change in market and leadership strategy, with a $0.05 diluted EPS impact; (v) $4.8 million associated with the implementation of an ERP consolidation plan, with a $0.04 diluted EPS impact; (vi) $19.9 million for professional fees in connection with our restructuring plan, with a $0.15 diluted EPS impact; vii) $2.2 million related to fiscal 2019 acquisitions, including inventory disposals and step-ups recorded in gross profit and acquisition-related professional fees recorded in SG&A, with a $0.02 diluted EPS impact; (viii) $0.7 million for losses resulting from the redemption of our convertible notes, with no effect on diluted EPS; (ix) $1.8 million for fair value adjustments to contingent earnout obligations, with a $0.01 diluted EPS impact; (x) $0.4 million associated with a change in ownership of a business in South Africa, as required by local legislation in order to qualify for doing business in South Africa, having no effect on diluted EPS; (xi) $1.3 million related to unusual compensation costs recorded resulting from executive departures related to our 2020 MAP to Growth initiatives, including equity compensation and severance expense, with a $0.01 diluted EPS impact; (xii) $6.5 million related to unusual compensation costs recorded, net of insurance proceeds, resulting from executive departures unrelated to our 2020 MAP to Growth initiatives, including equity compensation and severance expense, with a $0.05 diluted EPS impact; (xiii) investment losses of $7.7 million from sales of investments and unrealized net gains and losses on equity securities pursuant to new accounting rules beginning in fiscal 2019, which are adjusted due to their inherent volatility, with a $0.06 diluted EPS impact; and (xiv) an adjustment to tax expense for ($11.0) million for U.S. tax reform, with an ($0.08) impact on diluted EPS. • Fiscal 2020 excludes (i) $15.3 million resulting from product line and SKU rationalization at our Consumer Segment, as well as inventory write-offs in connection with restructuring activities at our Construction Products, Performance Coatings, and Specialty Products Segments, with a $0.12 diluted EPS impact; (ii) $27.7 million for restructuring expense, with a $0.21 diluted EPS impact; (iii) $17.3 million resulting from accelerated depreciation and amortization expense related to the shortened useful lives of facilities and equipment, ERP systems, and intangibles that are currently in use, but are in the process of being retired associated with 2020 MAP to Growth, including facility closures, exiting a business, and ERP consolidation, with a $0.13 diluted EPS impact; (iv) $2.6 million reflecting the net increase in allowance for doubtful accounts deemed uncollectible as a result of a change in market and leadership strategy, with a $0.02 diluted EPS impact; (v) $7.9 million associated with the implementation of an ERP consolidation plan, with a $0.06 diluted EPS impact; (vi) $15.6 million for professional fees in connection with our restructuring plan, with a $0.12 diluted EPS impact; (vii) $0.7 million related to fiscal 2020 acquisitions, including inventory disposals and step-ups recorded in gross profit and acquisition-related professional fees recorded in SG&A, with a $0.01 diluted EPS impact; (viii) $0.8 million related to unusual compensation costs recorded resulting from executive departures related to our 2020 MAP to Growth initiatives, including equity compensation and severance expense, with a $0.01 diluted EPS impact; (ix) ($1.8) million related to unusual compensation costs recorded, net of insurance proceeds, resulting from executive departures unrelated to our 2020 MAP to Growth initiatives, including equity compensation, with a ($0.01) diluted EPS impact; (x) $0.7 million related to loss incurred upon divestiture of businesses and/or assets, having no effect on diluted EPS; (xi) $6.6 million related to the discontinuation of a product line targeting OEM markets and related prepaid asset and inventory write-off that resulted from of ongoing product line rationalization efforts in connection with our 2020 MAP to Growth, with a $0.05 diluted EPS impact; (xii) $4.0 million reflecting the costs associated with exiting an unprofitable licensing agreement, with a $0.03 diluted EPS impact; (xiii) ($1.0) million reflecting the favorable adjustment that was the result of the resolution of a contingent liability related to a FY18 charge to exit our Flowcrete business in China, with a ($0.01) impact on diluted EPS; and (xiv) investment gains of $1.1 million from sales of investments and unrealized net gains and losses on equity securities pursuant to new accounting rules beginning in fiscal 2019, which are adjusted due to their inherent volatility, with a ($0.01) diluted EPS impact.
(3) Return on sales % is calculated as net income (loss) attributable to RPM International Inc. stockholders divided by net sales; return on total RPM International Inc. stockholders’ equity % is calculated as net income (loss) attributable to RPM International Inc. stockholders divided by the average of the current and prior year total RPM International Inc. stockholders’ equity; and total RPM International Inc. stockholders’ equity per share is calculated as total RPM International Inc. stockholders’ equity divided by average shares outstanding.